Year 2 Computing - Data Collection
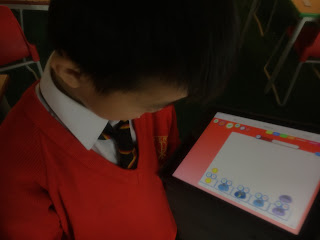
Year 2 have been applying their mathematical understanding of data collection through the use of an online pictogram website .
We revised how to use tally charts and then did our own survey, recalling previous data collection during our From A-B transport topic. Then we used the pictogram website to organise the results. We also answered various questions using mathematical vocabulary such as:
'What is the total?'
'How many more people like strawberries than pears?'
'Which animal does the farmer have the least of?'
As well as practising our computing skills we also had to use reciprocity skills to collect and record our data.
"It's easy to see which one is the most popular!" Henry
"I can count those easily because it's an array," Alister
"You cross the tally when it gets to 5 because it makes it easier to count - you can count in 5s," Heavenly


Comments
Post a Comment