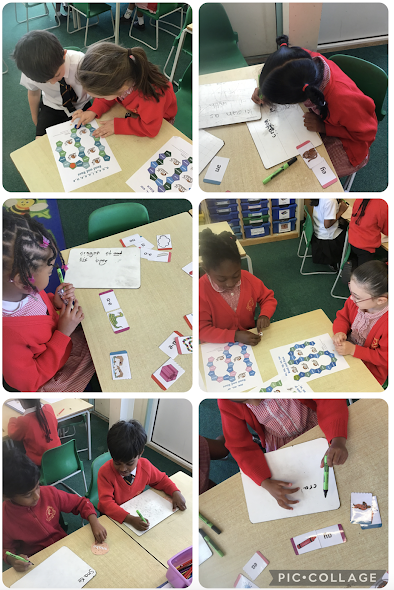
Statistics in Year 2

Year 2 are now learning about statistics. They were already aware of tallies as we use them when we collect house points! Today they collected data about a subject of their choice eg: favourite animal, different eye colours in class. They recorded this in a table and then worked out the totals. Counting in fives came in handy! The children then interpreted their data by writing facts they had found out using mathematical language! 'The most popular eye colour is brown!' Rapha 'The most popular fast-food is Burger King!' Melvin 'The least popular ice-cream flavour is mint sherbert!' Norah Next they will put their data into block graphs and interpret pictograms.